
The Pani ZED™ platform is a cloud solution that elevates the efficiency of industrial and municipal water treatment facilities. Its core function is to aggregate and ingest plant data from manual entries, lab reports and digitized sensors. This data is analyzed, visualized, and provides the information and Insights that operators need to optimize their plant's performance.
Pani ZED™ View and Focus are designed so that plant managers and administrators can configure most of the key parameters for water treatment plants, users, and reporting. You can be visualizing data within minutes, and a complete plant can be set up and configured in less than a day!
- Provide P&IDs, data sheets and historical data to the Pani team
- Enter in data that defines and describes the basic physical configuration of your plant. (5 minutes)
- Create forms
- Using the DATA tab, you use Form Builder to create forms that resemble your existing manual input forms and reflects any sensors you have in the plant. (5-30 minutes per form, depending on complexity)
- Using Form Builder, import any historical data you may have. (5-10 minutes per import/form)
- Create KPIs
- Using KPI Creator, you can use the sensors you created in Form Builder to create KPIs. KPIs combine sensors, arithmetic operators, constants and other KPIs into performance indicators you can use to operate the plant. (2-5 minutes per KPI)
- Create Alerts
- Alerts allow you to set thresholds for KPIs that notify plant operations of exceedances that require attention. (2-3 minutes per KPI)
- Create Users
- Create individual users and set their roles and permissions (Operator, Process Analyst, Manager, etc.).
- Create Overview Dashboards
- Create a variety of graphs and tables that provide key information on your plant.(5-30 minutes per dashboard)
- Test your plant
- If you have entered historical data, you should see Overview page reporting.
- Create your Procedures
- We provide several examples how different plant personnel interact with the platform. Use these as starting points as to create your monitoring/data entry/analysis/action plan processes for your teams.
|
|
9. Enjoy increased productivity, operational efficiency, and optimization!
View/Focus differences
Pani ZED™ View and Focus are nearly identical from a user interface perspective and in their capabilities. The main difference is Pani's View is designed for water treatment facilities that are 100% manual as far as data entry goes, whereas Pani's Focus supports direct data connections for more automated data logging. Because of this, Pani's Focus also has near real-time alert notifications, that View does not.
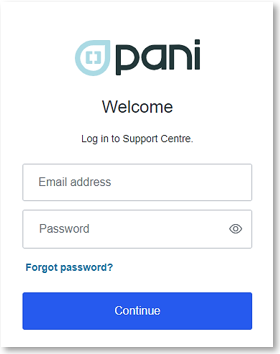
Logging in
A username and password will be provided to you and your team by either Pani or your site administrator. Once received you can log into your company’s platform via https:/www.mypani.com. You now have access to detailed information on your operation wherever you have internet!
Pani ZED™ Platform
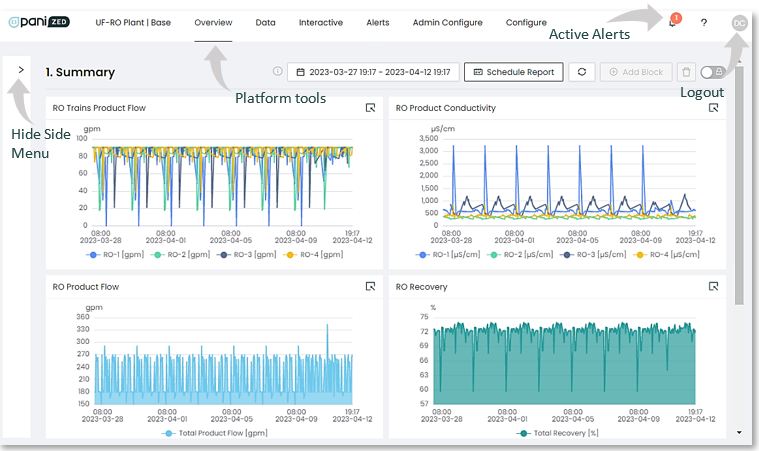
Once logged in you will see the Home page. From here you will have access to all the platform tools once you select a plant to view (click on it).
The platform has several “standard” usage modes. Once you understand these you will be able to extract maximum value and Insight from the reporting and views on the platform.
1. Scroll Wheel
- If a graph is selected (click on the graph), the scroll wheel will zoom in and out on the timeline.
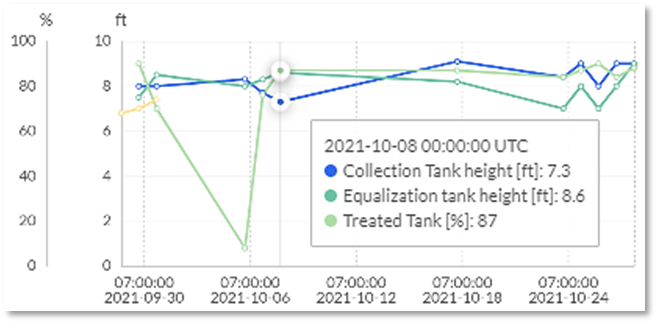
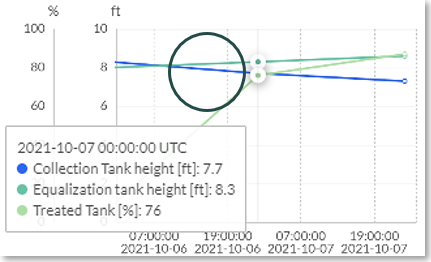
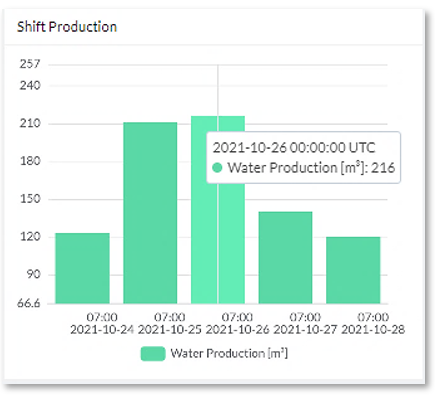
2. Mouse Over
- If the mouse cursor is placed over an area of a graph, it will display the actual values for the data being represented.
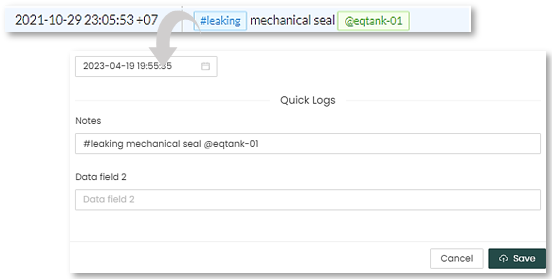
- This is also useful for when log entries are displayed in a graph, such as with Interactive. Moving the mouse cursor over the log entry bar on the graph displays the log entry notes for that day.
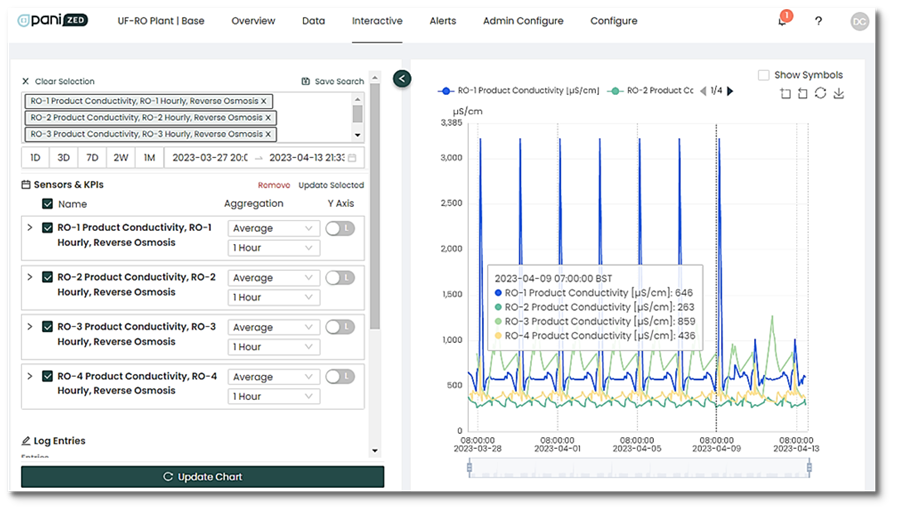
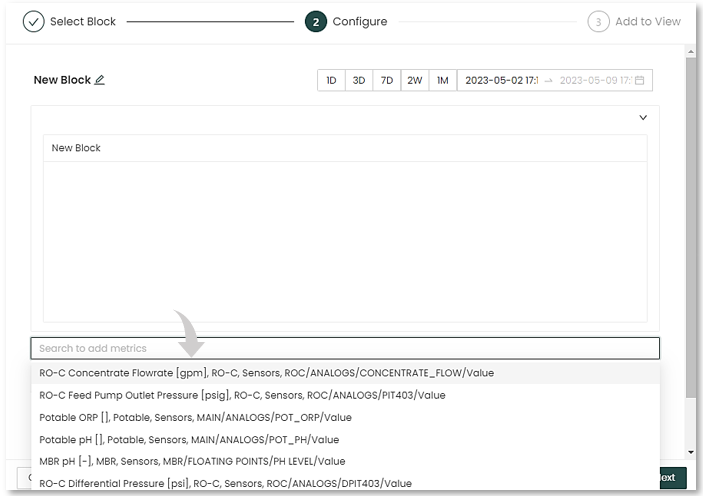
3. KPI/Sensor searching
- All KPI/Sensor searches can be filtered quickly by typing in part of the sensor name you are looking for. Things like “pressure” or “RO-1” or “flow” will reduce the number of displayed sensors to just those that contain the keyword, speeding up the sensor selection process.
4. Mouse Clicks
- Double clicking over a log sheet entry, allows you to quickly edit exiting entries.
Platform Tool
The main menu bar provides the primary navigation for the platform. Depending on the product plan (View or Focus) the following tabs will be visible: *
| Tool | Description | Plan |
| Home | A place to view all plants in your fleet. | View & Focus |
| Overview | Pre-built dashboards or the option to build custom dashboards. | View & Focus |
| Data | Section to enter manual entries to complement the automated sensor data. Log entries can include lab analysis, manual readings of non-digitized sensors, daily logs, and other data that allows Pani's technology to provide analysis. | View & Focus |
| Interactive | Tool for root cause analysis or operations analysis. | View & Focus |
| Alerts |
Key performance indicators (KPIs) notifications that allow monitoring and evaluation of system-specific processes and assets. |
View & Focus |
| Admin Configure | Administrators can configure parameters for automatic sensors etc. | Focus |
| Settings | User settings. | * |
* Additional tabs may not be visible based on user permissions and custom configurations. Check with your system administrator for further information.

