
Best Practices for RO Operation and Data Collection
This document is designed to assist the user in best practices to implement in operation and data collection tasks. The article describes the tasks that are required to effectively operate a reverse osmosis plant and details features and workflows within the Pani digital platform that are used to accomplish these tasks. The Pani workflows may result in changes to existing task flows at the plant, however they will improve operational visibility which will increase plant reliability and efficiency.
|
The following conventions are used throughout this article and are described below:
|
The Plant Operator performs multiple tasks that are identified by the Plant Engineer as necessary for sustainable operation of the plant water system. These responsibilities include:
1. Calibrating instrumentation that is required for the capture of critical data.
Calibration should be performed on a routine schedule as recommended by the manufacturer of the monitoring instruments, but at a minimum, calibrations should be performed quarterly. Measurements from hand-held meters should be verified against a standard daily and recalibrated on a schedule specified by the manufacturer. Instruments, gauges, flow meters, or other sensors that will not retain calibration should be replaced by the operator.
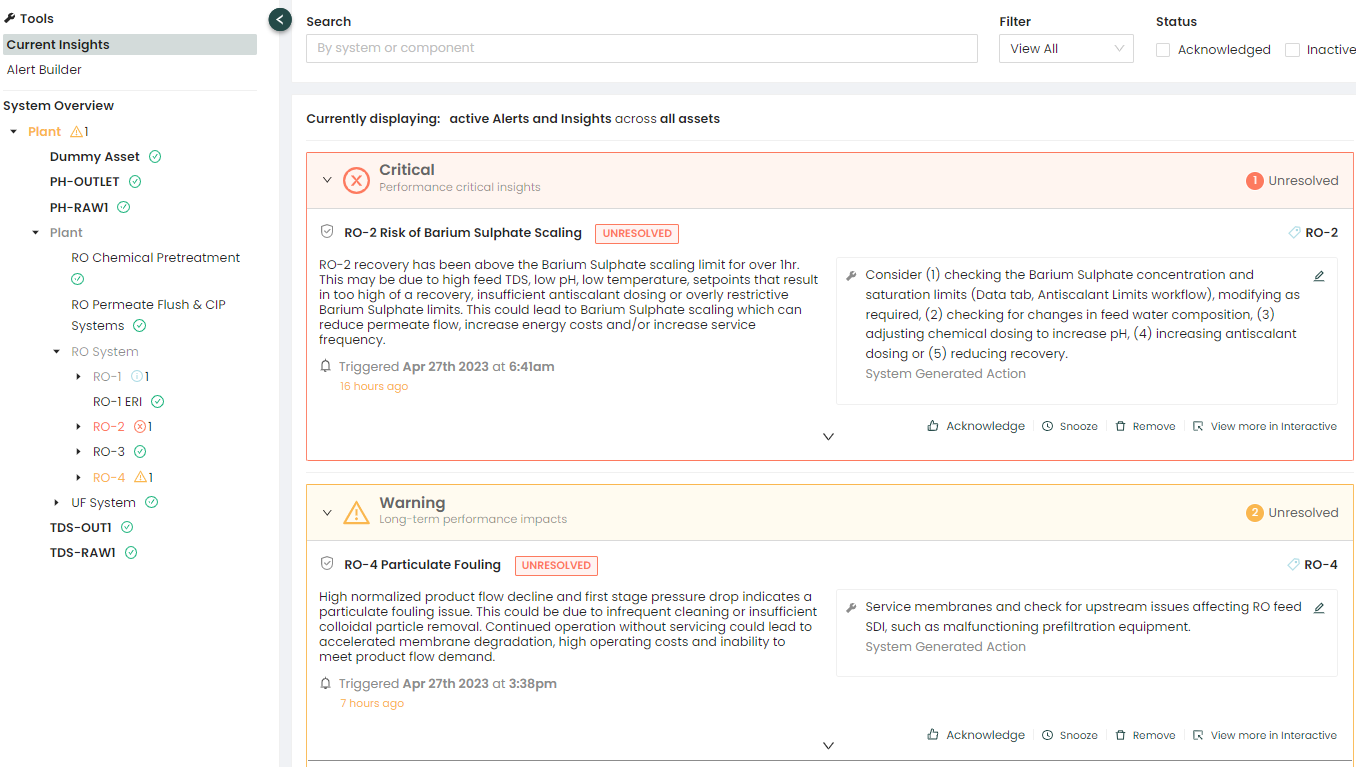
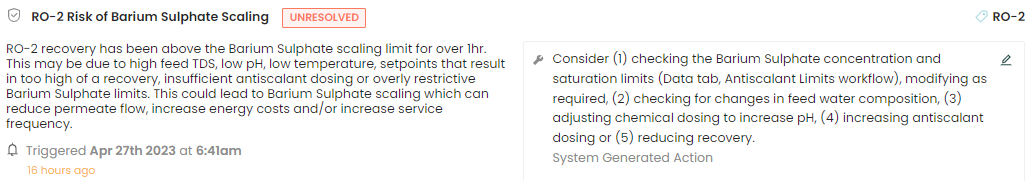
Pani Zed's Insights and alerts may trigger if sensors go out of calibration, providing the operator a notification. If a particular alert triggers often, it may be an indication that calibration of the sensor may be required.
|
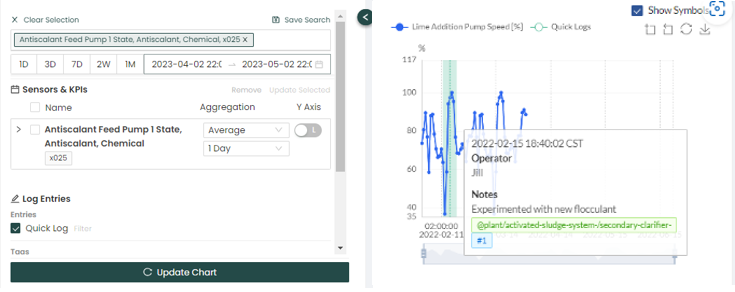
An example of Insights/Alerts triggering is shown below:
* for information on how to address the Insight/Alert click here 🖱. |
2. Collecting required data pertaining to feed water.
Conditions such as Temperature, pH, Conductivity should be taken and recorded in a logbook at least daily under normal circumstances. Free and Total Chlorine (residuals before and after dechlorination), Turbidity (as NTU), and ORP should be measured weekly. Depending on the source of the feed water, additional testing such as SDI may be required periodically (quarterly). For surface water supplies, SDI should be measured at least weekly and system operation adjusted accordingly to minimize the effects of changes in water quality on membrane operations.
Feedwater analysis should be entered into the Pani Data workflow for feedwater analysis. Feedwater analysis values are used in normalization equations and in other KPIs.
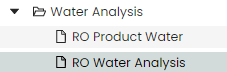
Water Analysis Log Sheets can be created by the Manager or Engineer to assist with data collection:
|
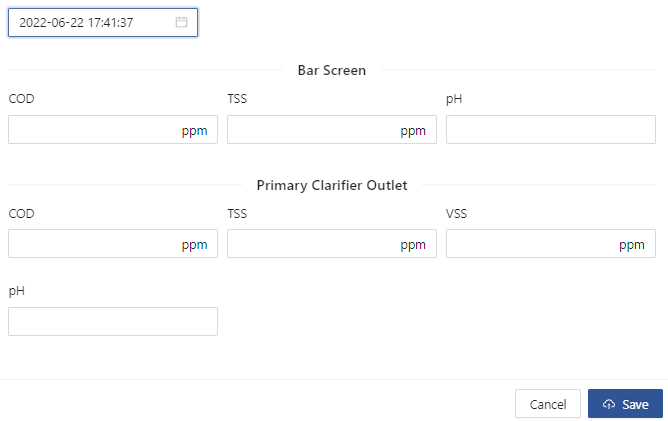
An example of a water analysis form for use by the Operator is shown below:
|
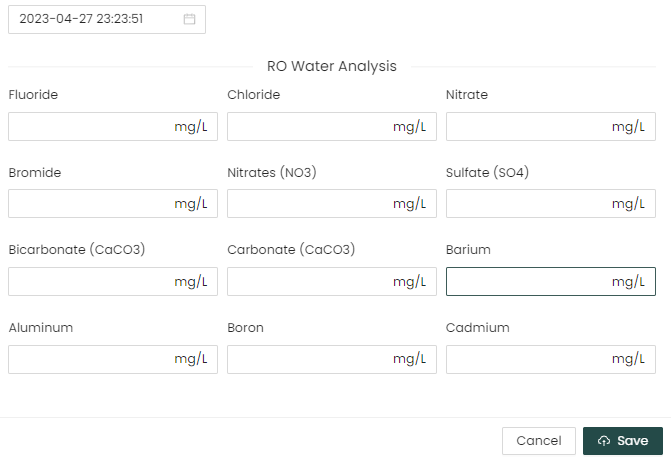 Select the date and time, then enter your data in all the fields. once complete save the form.
3. Equipment upstream of the RO should be checked for proper function once per shift.
This includes differential pressures for any prefiltration (media filters, bag filter, backwashable screen filters, and cartridge filters), water softeners, or specialty filters such as iron filters, to ensure operation within specifications, proper function and flow from booster pumps and chemical injection pumps.
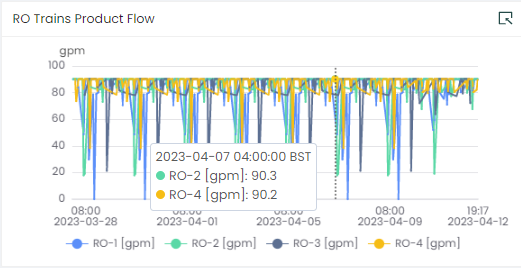
Pani Zed's Insights and alerts may trigger if filters become clogged. This is typically indicated by an increase in pressure readings, reduced salt passage, reduced product flows, etc. Monitor these values by creating Views in Overview that display these parameters and Alerts that can be used to warn when various sensors are nearing operational limits. In Pani Genius, many of these issues may be predicted in the Time to Service/Forecasting module.
|
An example of an RO Trains Block in Overview is shown below:
|
Additional test, such as iron or hardness testing, may be assigned to pretreatment operations by the plant engineer. This will help ensure the maximum efficiency of the pretreatment equipment. Any additional measurements should be recorded in a log sheet.
For these tests, it is recommended that the plant manager create a Workflow in the Data page to log these entries. Logging these entries in Pani Zed allows managers and process analysts to trend these test results and create KPIs that can improve operator awareness plant efficiency.
|
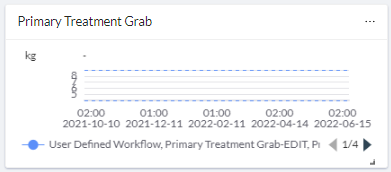
An example of Primary Treatment Log Sheet is shown below:
|
This should be verified daily ideally using a drawdown tube to verify pump operation. Reduction in supply volume by measured changes in container liquid level or change in container weight may also be used if monitored daily.
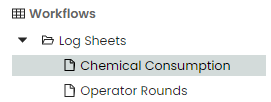
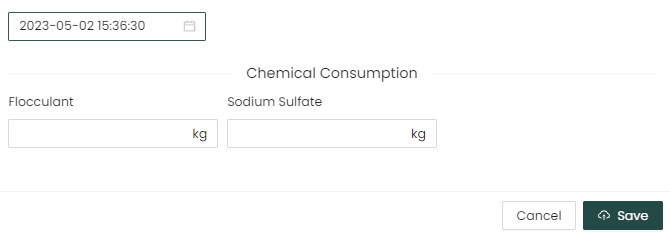
In the Pani platform, managers or PAs can create Workflows/Log Sheets in the Data page. When chemical consumption is logged and tracked in Pani Zed, managers and process analysts can use these inputs to calculate operation costs (chemical consumption) and abnormal usage patterns.
|
A basic example of using a Chemical consumption Log Sheet is shown below:
|
6. Additional observations related to the operation of the plant.
These should also be recorded when observed. These would include visible leaks, unusual sounds, or odors outside of those normally encountered during operation.
The performance of the RO system is determined by its ability to provide the proper volume of purified water within a predetermined range of quality parameters while operating within defined setpoints for pressures and flows. The operating data collected on the log sheets should consist of feedwater flow rates, feedwater pressure at the point of entry into the RO system, feedwater conductivity measured after all pretreatment operations (post-cartridge filter), concentrate Flow and conductivity, concentrate pressure, permeate flow and conductivity, permeate pressure, and a measurement of pressure between each stage of the system, if available.
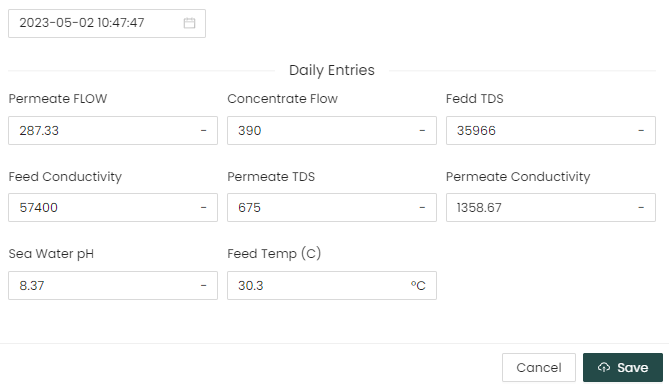
Pani calculates this information by using KPIs and sensors that measure feed, flow, etc. An example can be seen in the Daily Operating Log below:
The Plant Engineer or Manager prepares the Daily Log Sheet from which the Operator will enter the daily data.
The Operators workflow for this would be to record data into the Log at the specified intervals during their shift. There can be many Log Sheets created each for recording specific tasks. In this instance we will be using a Daily Operating Log as an example.
|
As an example, this is how to fill out a typical Log Sheet:
|
 You can view the data entries entered in the form by clicking on it, and selecting the date range of collected data you want to review in the main screen, as shown below:
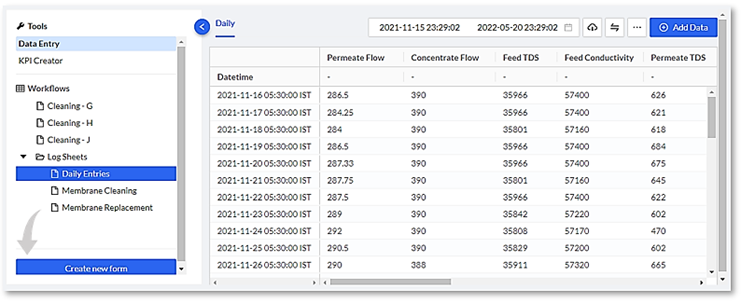
A Maintenance Log should be maintained separately from the daily performance logs. This log should record:
- Routine maintenance.
- Mechanical failures and replacements.
- Any change of membrane element locations with element serial numbers. Serial number location in the system is recommended during the initial membrane loading and any time membranes are subsequently replaced. The membrane manufacturer and the installed model number should also be recorded for future reference.
- Replacements or additions of RO devices.
- Date of calibration for all gauges and meters.
- Replacement or additions of pretreatment equipment, for example cartridge filters, and include date, brand name and nominal rating.
- All cleanings of RO membranes. Include date, duration of cleaning, cleaning agent(s) and concentration, solution pH, temperature during cleaning, flow rate and pressure.
The workflow for capturing maintenance data includes the following:
- The Maintenance Log can be recorded either in the provided Quick Log (recommended).
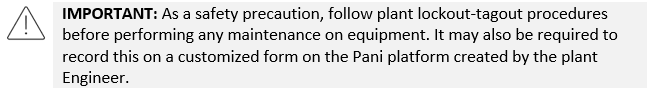
- Or custom maintenance forms prepared by the Engineer or Manager in the Data page on the Pani Platform. Custom maintenance forms can be used for larger plants and may contain separate Calibration and Equipment Runtime logs.
The following workflow for this assumes a Quick Log is being used. The Operator enters information into the Quick Log using these methods:
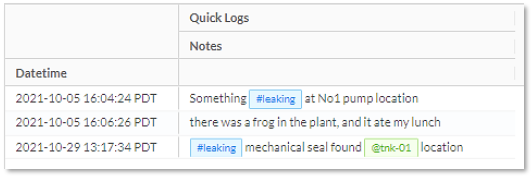
Hashtags # can be used for future reference to generate keywords for this and future events. If you are entering a log for “Temperature” type in #temperature and this keyword will not only be associated with this event but will be available for future events as well.
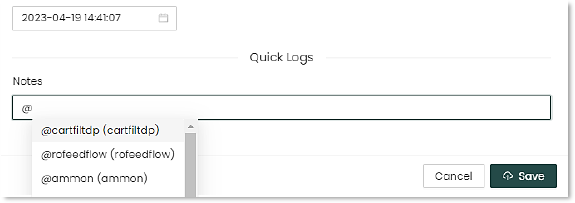
Assets can also be tagged using the @ symbol. This allows you to create a log of issues with a particular pump, for example, and reference that in future logs.
When you type # or @ into the notes area, a list of either tags or assets to select from will appear in the dropdown listings.
Here's an example of how to create a calibration event "#Calibration @pH_sensor345 calibrated per MFG spec." Creating the event in the Quick Log allows the entry to show up in reporting on the Pani Platform.
|
An example of entering data into a Quick Log entry:
|

In addition to maintaining the plant logs, part of the Operators workflow, could include the servicing and replacement of RO Membranes at the direction of the Plant Engineer:
Membrane System Service Workflow
For some implementations, dedicated RO or other workflows may be present. The Pani platform includes tools where these tasks can be recorded and used for later analysis.
These workflows are process specific and are configured by platform.
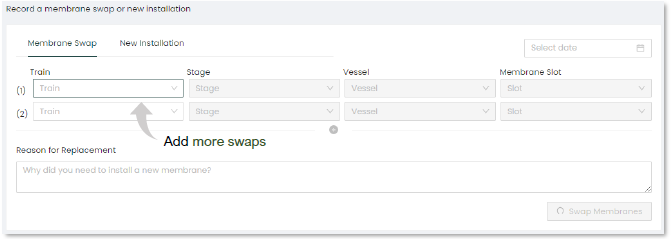
The membrane swap allows the user to enter data on membranes that have been swapped in the RO vessels. This helps operations keep track of all swapping activities and keeps an inventory and historical track record.
|
An example of how to record a Membrane Swap:
History
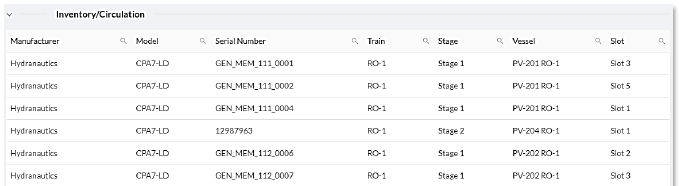
Inventory/Circulation
|
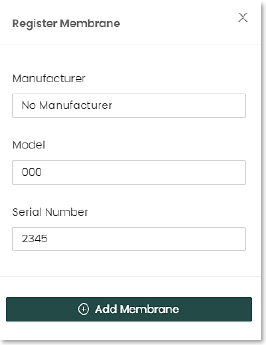
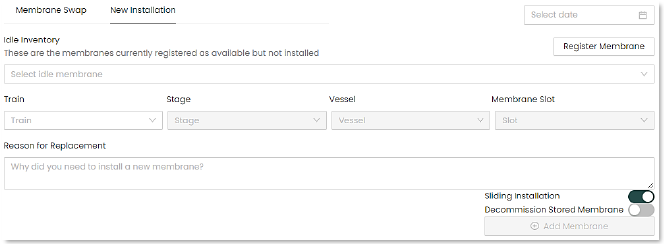
The membrane installation section helps operations manage membrane installations and registers new membranes into the system. This along with “Membrane Swap” will assist operations with membrane management by creating a membrane inventory and activity history.
To enter a new membrane installation, the membrane must be registered in the facility’s inventory.
|
An example of how to Register a New Membrane:
Once registered the membrane can be swapped or installed. To install a membrane:
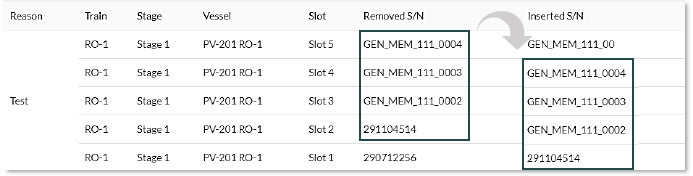
Selecting "Sliding installation" will automatically move the membranes to new locations, as indicated by the following diagrams.
|

Monitoring performance and Insights/Alerts
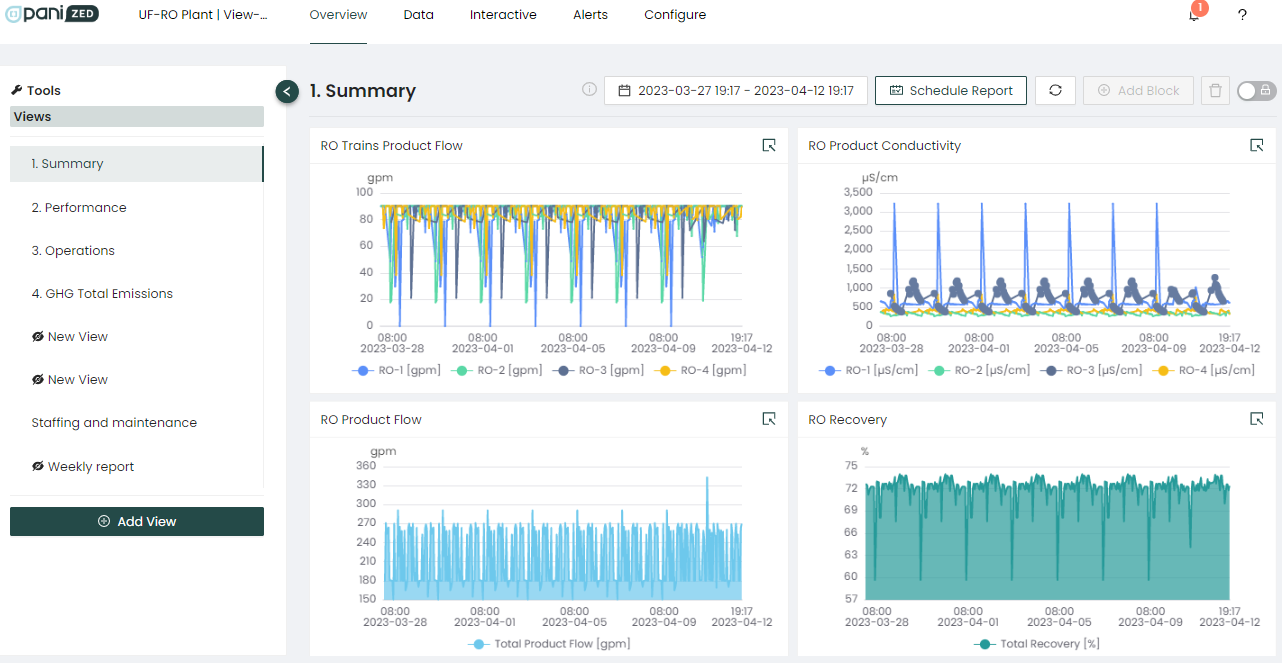
Another part of the Operators workflow is to monitor overall performance on the Overview page. If any anomalies appear, use the Interactive page to drill down into one or more sensors to perform root cause analysis which is normally performed by the Engineer.
|
The Overview page is shown below with a selected Dashboard:
|
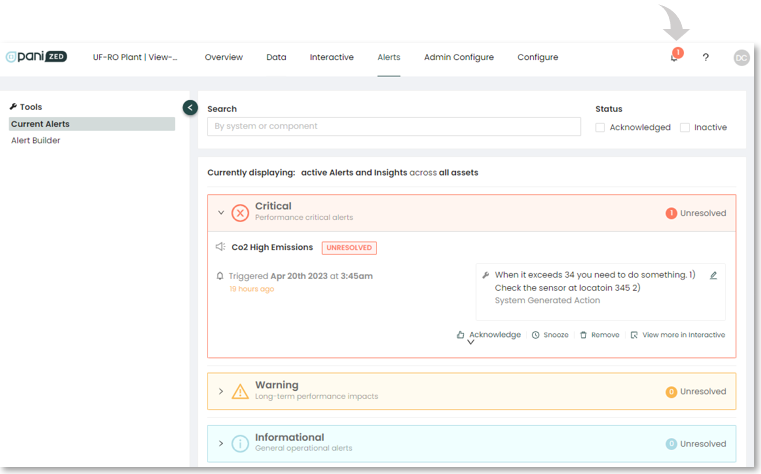
Monitor the Insights/Alerts status on the Pani platform in the upper right-hand corner of the screen and respond in a timely manner to any new the alerts that may occur. Insights/Alerts that are triggering generate an alarm notification in the upper right-hand portion of the Pani platform, instantly notifying operators that there is an item needing their attention.
These Insights/Alerts are normally created by the plant Engineer using KPI’s and setting the limits that will trigger them, or generated by Pani for use in plants with automation.
Operator Acknowledgement and Addressing Alerts/Insights when triggered are key to keeping informed when systems or processes exceed limits.
|
How to address Alarms/Insights being triggered is shown below:
1: Once an Insight/Alert has triggered, review information and recommend action.
|
To Summarize
- Periodic maintenance and constant monitoring of systems is critical to to plant operations.
- Use the Pani dashboards/Views and workflows provided on the platform to simplify and organize these steps and processes.
- Use Alerts and the visualization tool provided by management to to continually monitor plant performance.
Help Center
Need help? It’s just a mouse click away on the Platform.

Just click on the “?” icon located on the upper right corner of the screen, and you will have immediate access to the Help Center. Here you will be able to access the Knowledge base with how-to step by steps, video tutorials, FAQ’s, and more.

